Intro — Reading the Forecast Report Card
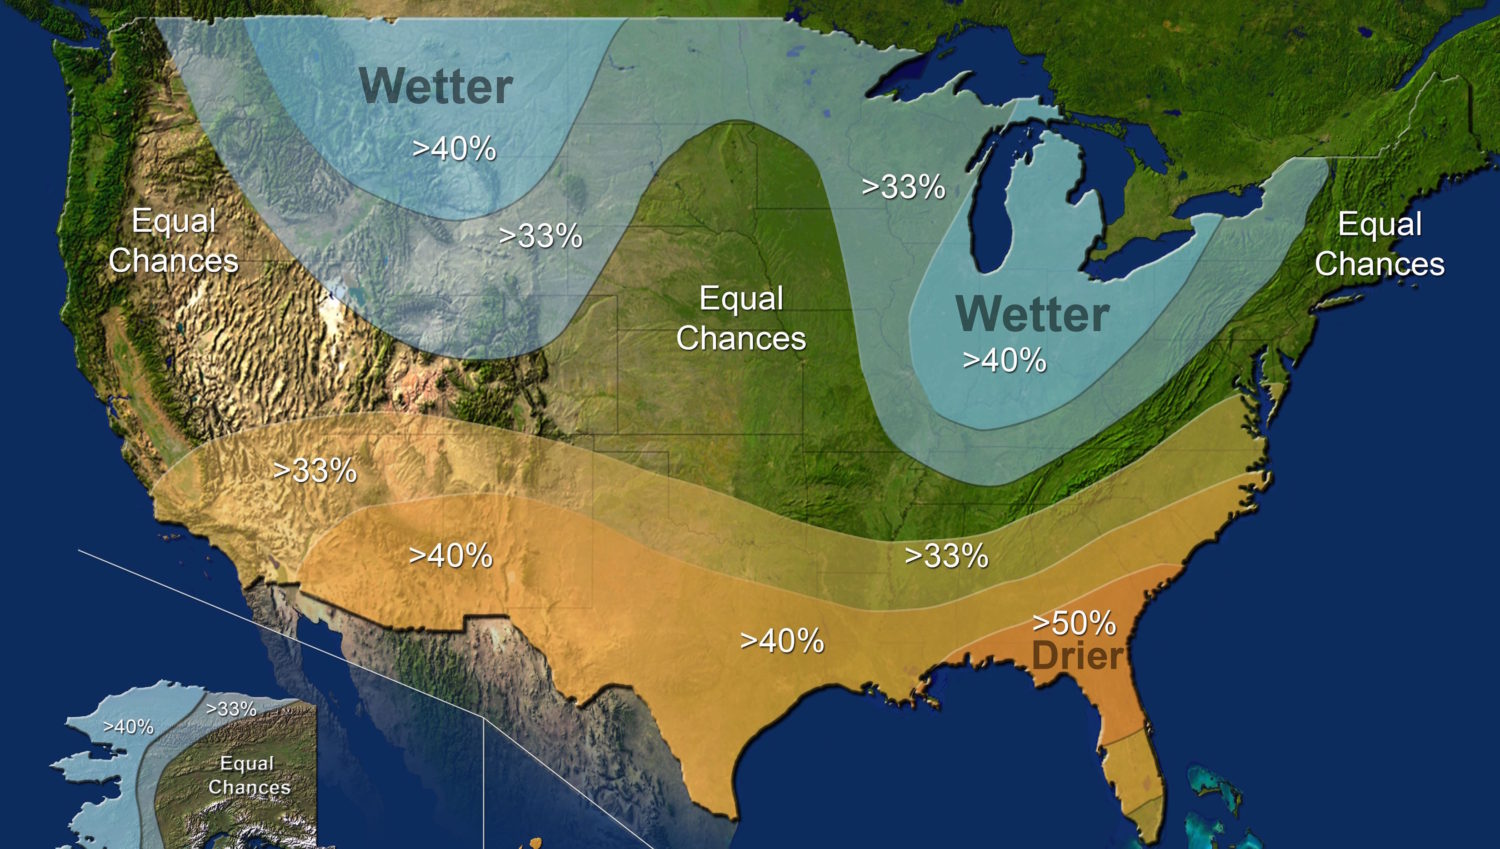
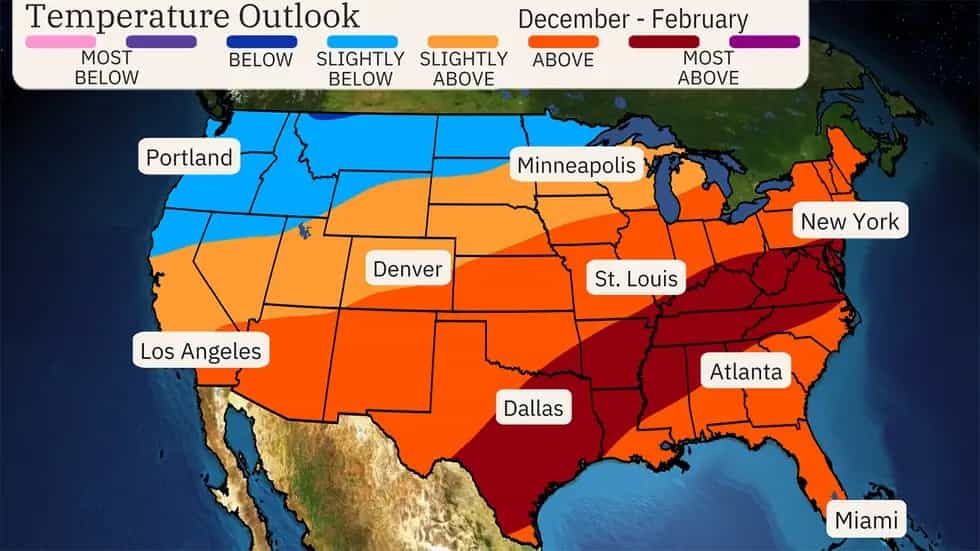
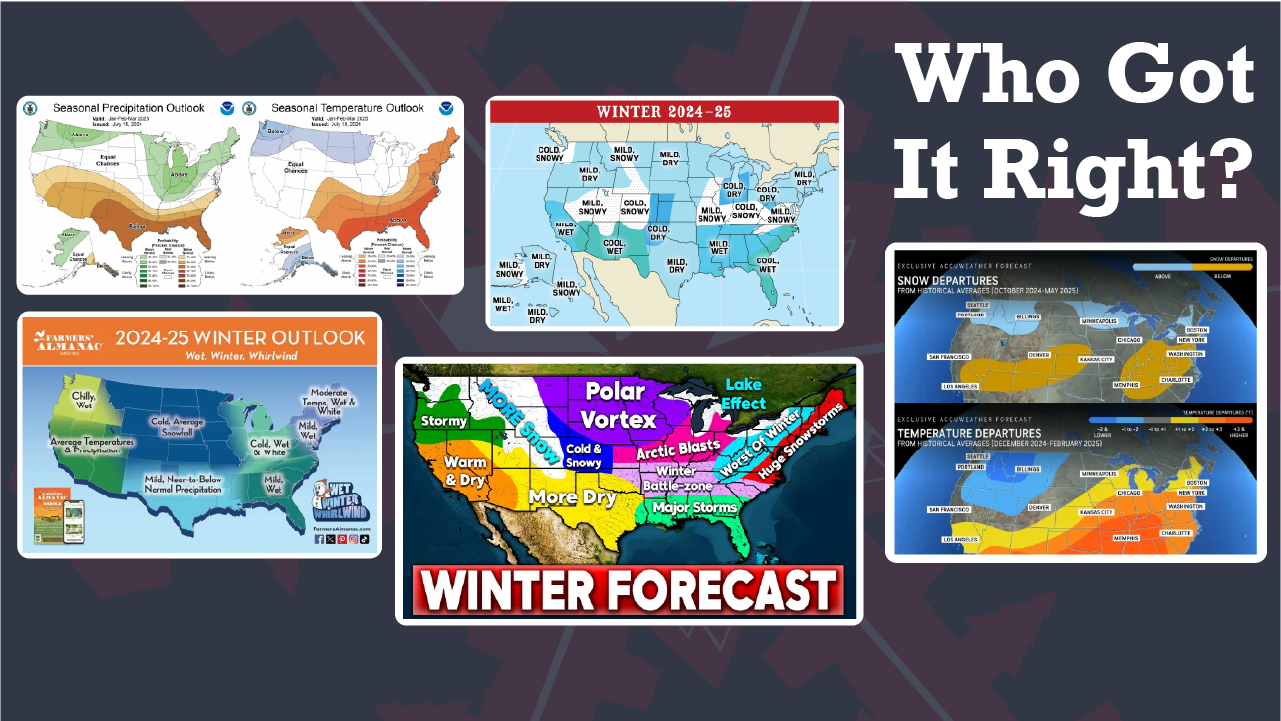
Every September, the big forecasting brands splash colorful maps across social feeds, promising everything from “Worst of Winter” bullseyes to “Mild & Dry” respites. Now that lifts are grinding to a halt, we pored over snow-water-equivalent charts, resort snow ledgers, NOAA climate summaries, and more to see who nailed (or whiffed) the 2024-25 outlook. Disclaimer: our letter grades reward nuance; broad-brush labels like “Cold & Snowy” can hit the mark almost by default in large regions, while precise north-south gradients are harder—and riskier—to call. Keep that handicap in mind as you dive into the scorecard below.
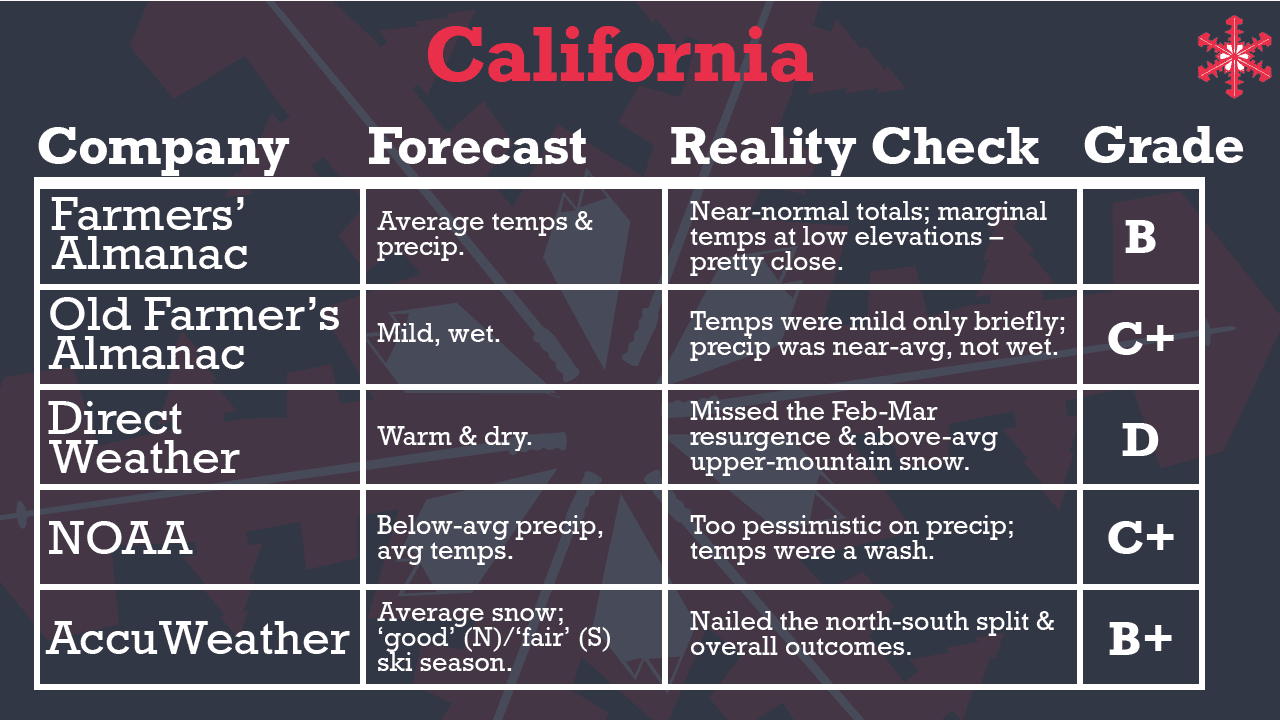
California
What Actually Happened — Full-Season Rundown
- Early Season (October to November): A couple of cold shots plus aggressive snowmaking let Mammoth spin six lifts for Thanksgiving, while Tahoe made do with ribbons of white.
- December: Two late-month storms (1-3 feet) finally built 2-4 foot bases in Tahoe and 4-5 feet at Mammoth; upper-mountain skiing was solid, lower elevations remained scratchy.
- January Slump: High pressure dominated; aside from a lone 12″ dump east of Tahoe, mid-winter relied on man-made snow.
- February Flip: A warm atmospheric river (AR) February 4-7 rained to 8,000 feet but dropped four feet of snow above that line; a colder storm February 12-15 added three feet at Tahoe and over four feet at Mammoth, pushing upper-mountain SWE (snowpacks) to ~130 % of median.
- March Madness: Three troughs March 1-15 delivered 3-5 feet of snow with low snowlines; a final March 30-April 2 pulse added 2-4 feet just before the spring warm-up.
- Season Totals: Palisades Tahoe 376″ (94 %), Mt. Rose 359″ (122 %), Mammoth 280″ (81 %). High terrain finished near average to just above average on final SNOTEL SWE maps.
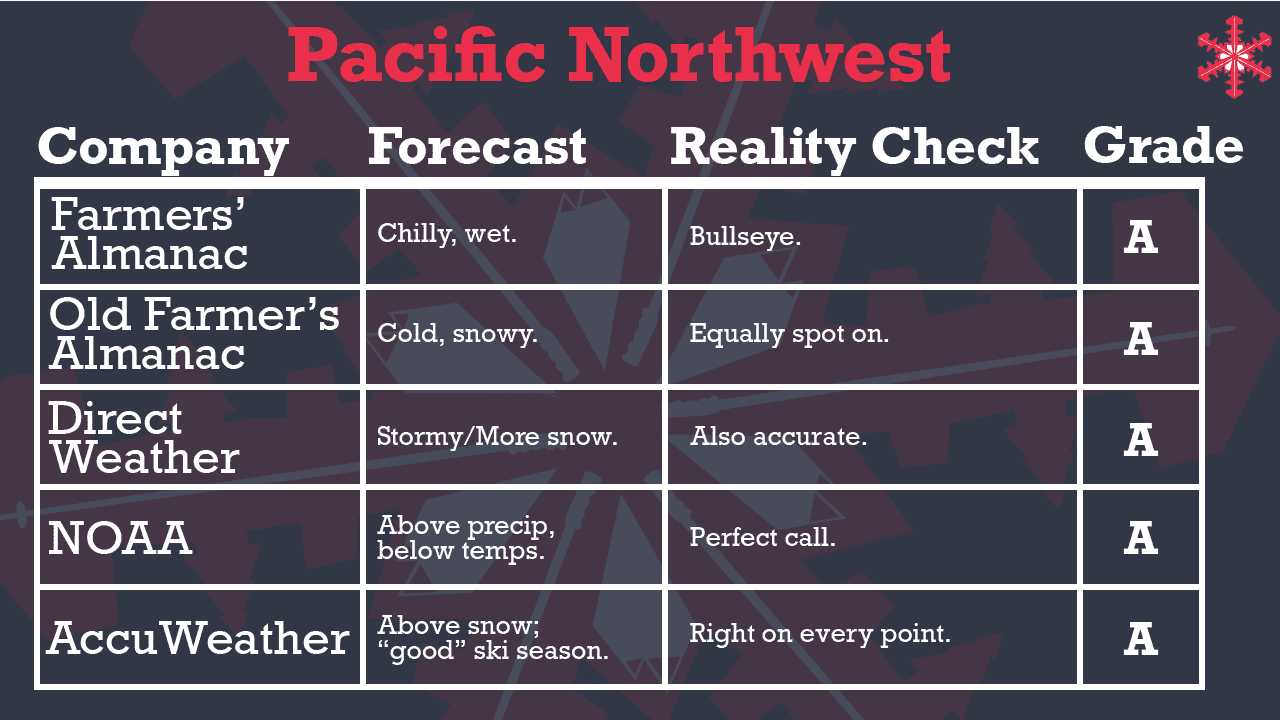
Pacific Northwest
What Actually Happened — Full-Season Rundown
- Record November: Four Gulf of Alaska storms buried the Cascades and Coast Range; Bachelor’s Summit opened December 10 (earliest in a decade) on a 70″ base.
- December to Christmas: Two more 30-40″ cycles; Whistler, Mt. Bachelor, Mt. Hood, and Crystal Mountain all crossed 100″-to-date by December 24 and sat >95 % open.
- January Variability: Early January added 18″, then a three-week dry ridge produced firm pistes but preserved the deep pack.
- February AR Roller-Coaster: 2-4 feet of snow in the first half; warm atmospheric river rain mid-February, followed by a 20″ dump, reset surfaces.
- March Bonanza: Six short-wave troughs; Whistler over nine feet of snow, Oregon volcanoes over 10 feet, and base depths >150″.
- April: Quick 18″ refresher April 4-7 before spring. Season SWE closed at 120-175 % of median.
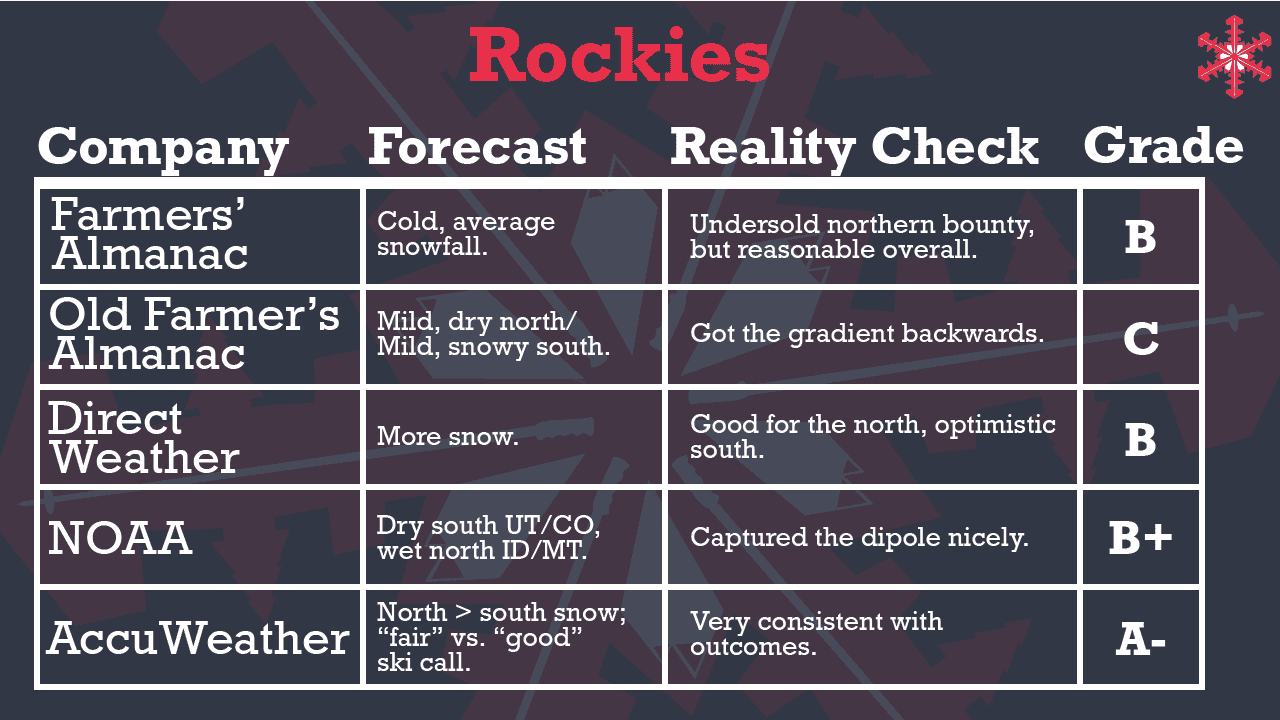
Rockies
What Actually Happened — Full-Season Rundown
- Northern Rockies (ID / MT / WY): Back-to-back November storms hammered the Selkirks and Tetons—Grand Targhee was 100 % open by December 5. A two-storm February reload stacked five feet of snow in the Tetons and SW Montana, followed by a pair of foot March events and an April two-footer. Resorts like Schweitzer, Bridger Bowl, and Jackson Hole finished 400–450″, or 150–190 % of normal.
- Central Rockies (CO): The snowiest November since 2010 (2–3 feet late-November) set the table, but January stalled. A two-week February frenzy then piled six feet of snow on Steamboat, Vail, and Winter Park; two more two-foot cycles in March and a teens-inch April refresher pushed season totals to 300–340″—about 90–110 % of average.
- Wasatch (UT): A slow start (<3 feet of snow pre-Christmas) gave way to dual atmospheric rivers in early February that dumped five feet in the Cottonwoods. March added three feet, and another 30″ fell in early April. Alta logged 522″ (109 %), while Park City settled at 237″ (85 %).
- Southern Rockies (NM & South CO): Wolf Creek opened October 22, but New Mexico then endured six dry weeks. February delivered only 12–18″, and the SW Colorado corridor stayed <70 %. A four-foot storm at Wolf Creek in early March, plus Taos’ long-awaited Kachina opening on March 17, salvaged some turns. Wolf Creek finished ~350″ (~105 %), but most New Mexico hills ended 60–85 % of normal.
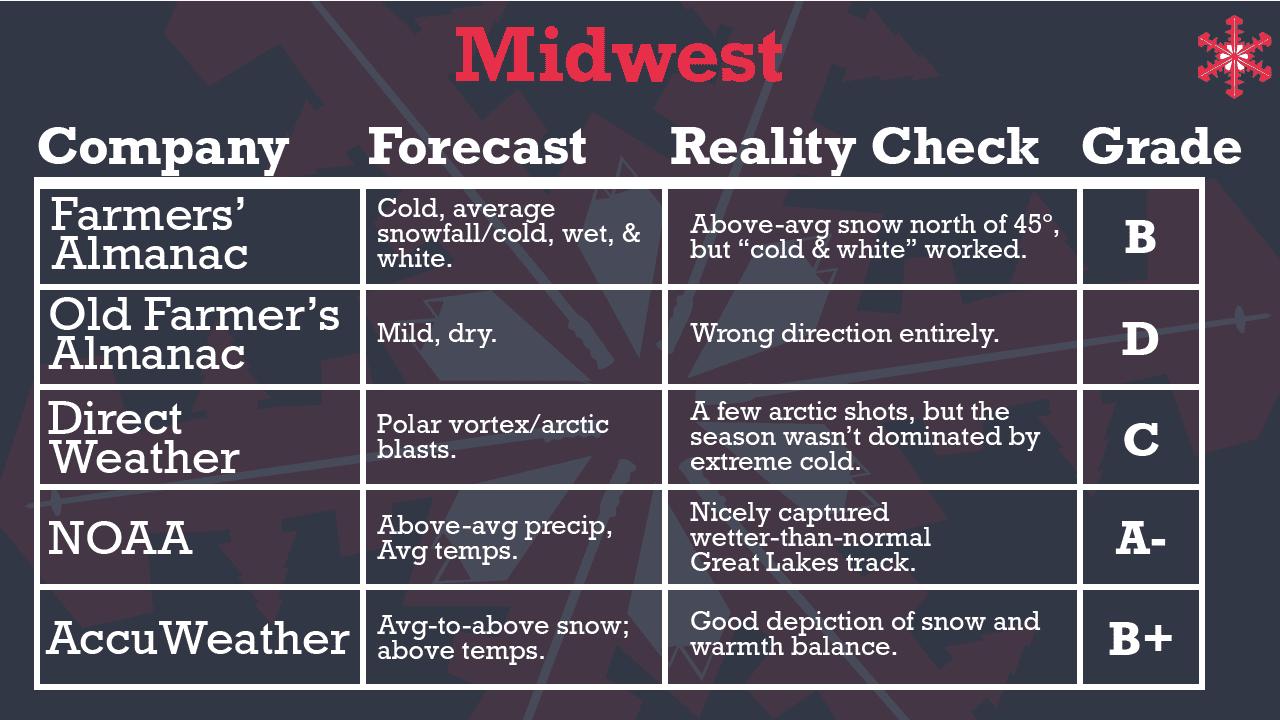
Midwest
What Actually Happened — Full-Season Rundown
- Upper Peninsula, Michigan: Persistent NW flow cranked lake effect; February logged 49″ at Munising (184 %) and 31″ at Ironwood (130 %). Mount Bohemia unofficially topped 300″ — triple normal.
- Northern Minnesota: Lutsen opened December 6; frequent clippers plus Superior enhancement kept terrain open to April 27.
- Wisconsin & Lower Michigan: Granite Peak and Cascade met their 50-60″ norms but leaned on snowmaking; most hills 100 % open into mid-March.
- Temperature Character: Two arctic fronts (late January and mid-February) drove sub-zero wind chills, but winter averaged +1 to +3 °F above normal.
- Net-Net: Snow-belt resorts enjoyed a proper powder winter; southern hills logged “average but long” seasons.
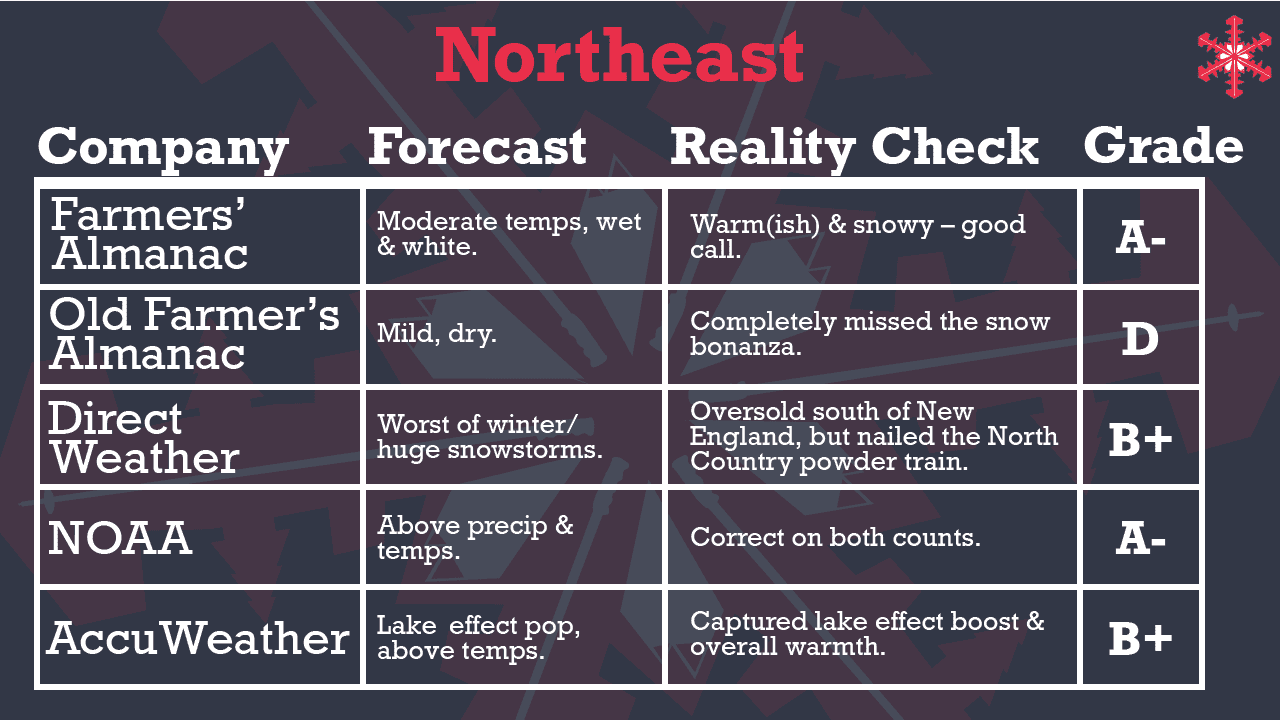
Northeast
What Actually Happened — Full-Season Rundown
- Start-Up: October warmth delayed openings; Killington & Sunday River opened November 15 on slivers of man-made.
- December: 12-18″ Nor’easter December 3-5 jumpstarted coverage; another 18-24″ Christmas week locked in a sustained powder stretch.
- January – Early February: La Niña clipper parade — Jay Peak +6 feet of snow in January; Stowe 348″ (131 %), Sugarbush 273″ (113 %).
- Mid-February – Early March: Warm rain from December 29-31 replayed March 2-3, slashing low-elevation counts; backside snow fixed it within 48 hours.
- Late Season: 30-36″ storm March 20-27 revived coverage; April 11-12 clipper reopened 80-90 % of trails before high sun finally won.
- Overall: Northern New England finished 110-140 % of normal; southern zones ~90-100 %.
Company-Wide Report Cards
AccuWeather: Consistently highlighted north-versus-south gradients (California, Rockies), nailed the PNW bull-eye, and was one of only two outlets to flag Great Lakes lake effect in the Midwest. A couple of slight misses on California snowfall magnitude keep it from perfection.
Final Grade: A-
NOAA: The government maps were spot on in three of five regions (PNW, Rockies gradient, Northeast), and the Midwest call was excellent. However, a too-dry California forecast and uncertainty in Central Colorado prevent an “A.”
Final Grade: B+
Farmers’ Almanac: Folksy? Yes—but surprisingly sharp this year. Direct hits in the PNW and Northeast, and a respectable read on the Rockies, offset slight over/undershoots in California and the Midwest.
Final Grade: B+
Direct Weather: Crushed the West Coast (PNW & “More Snow” Rockies north half) but stumbled on California warmth/dryness and exaggerated Midwest cold. Eastern hype limited the score.
Final Grade: B-
Old Farmer’s Almanac: One bright spot in the PNW can’t mask big whiffs elsewhere—especially the “mild, dry” Northeast forecast during a 130 % of normal snow year.
Final Grade: C

Key Take-Aways
- Consensus wins in the PNW. Every forecaster caught the chilly, wet El Niño-flavored pattern that buried the Cascades.
- California remains a head-scratcher. Only AccuWeather’s “average but north-favored” call came close.
- Rockies require nuance. Broad-brush descriptors struggled with the sharp north–south gradient, while AccuWeather and NOAA’s zonal maps shone.
- Midwest love for the Lake Belt. NOAA and AccuWeather were the only outlets to spotlight Great Lakes boosts.
- Old vs. new almanacs. The elder Almanac’s warm-dry East idea failed, whereas its Farmers’ cousin punched above its weight.
The tally shows that data-driven, probability-based maps (NOAA, AccuWeather) still edge out the folksy throwbacks, but the Farmers’ Almanac made this a closer race than usual. We’ll see who studies up before next season’s exam!