This post first appeared on the climate.gov ENSO blog and was written by Emily Becker.
The Pacific Ocean has hit pause and settled into ENSO-neutral conditions, which are expected to continue through the Northern Hemisphere summer. This makes seasonal forecasting for upcoming global rain, temperature, and other patterns a bit trickier.
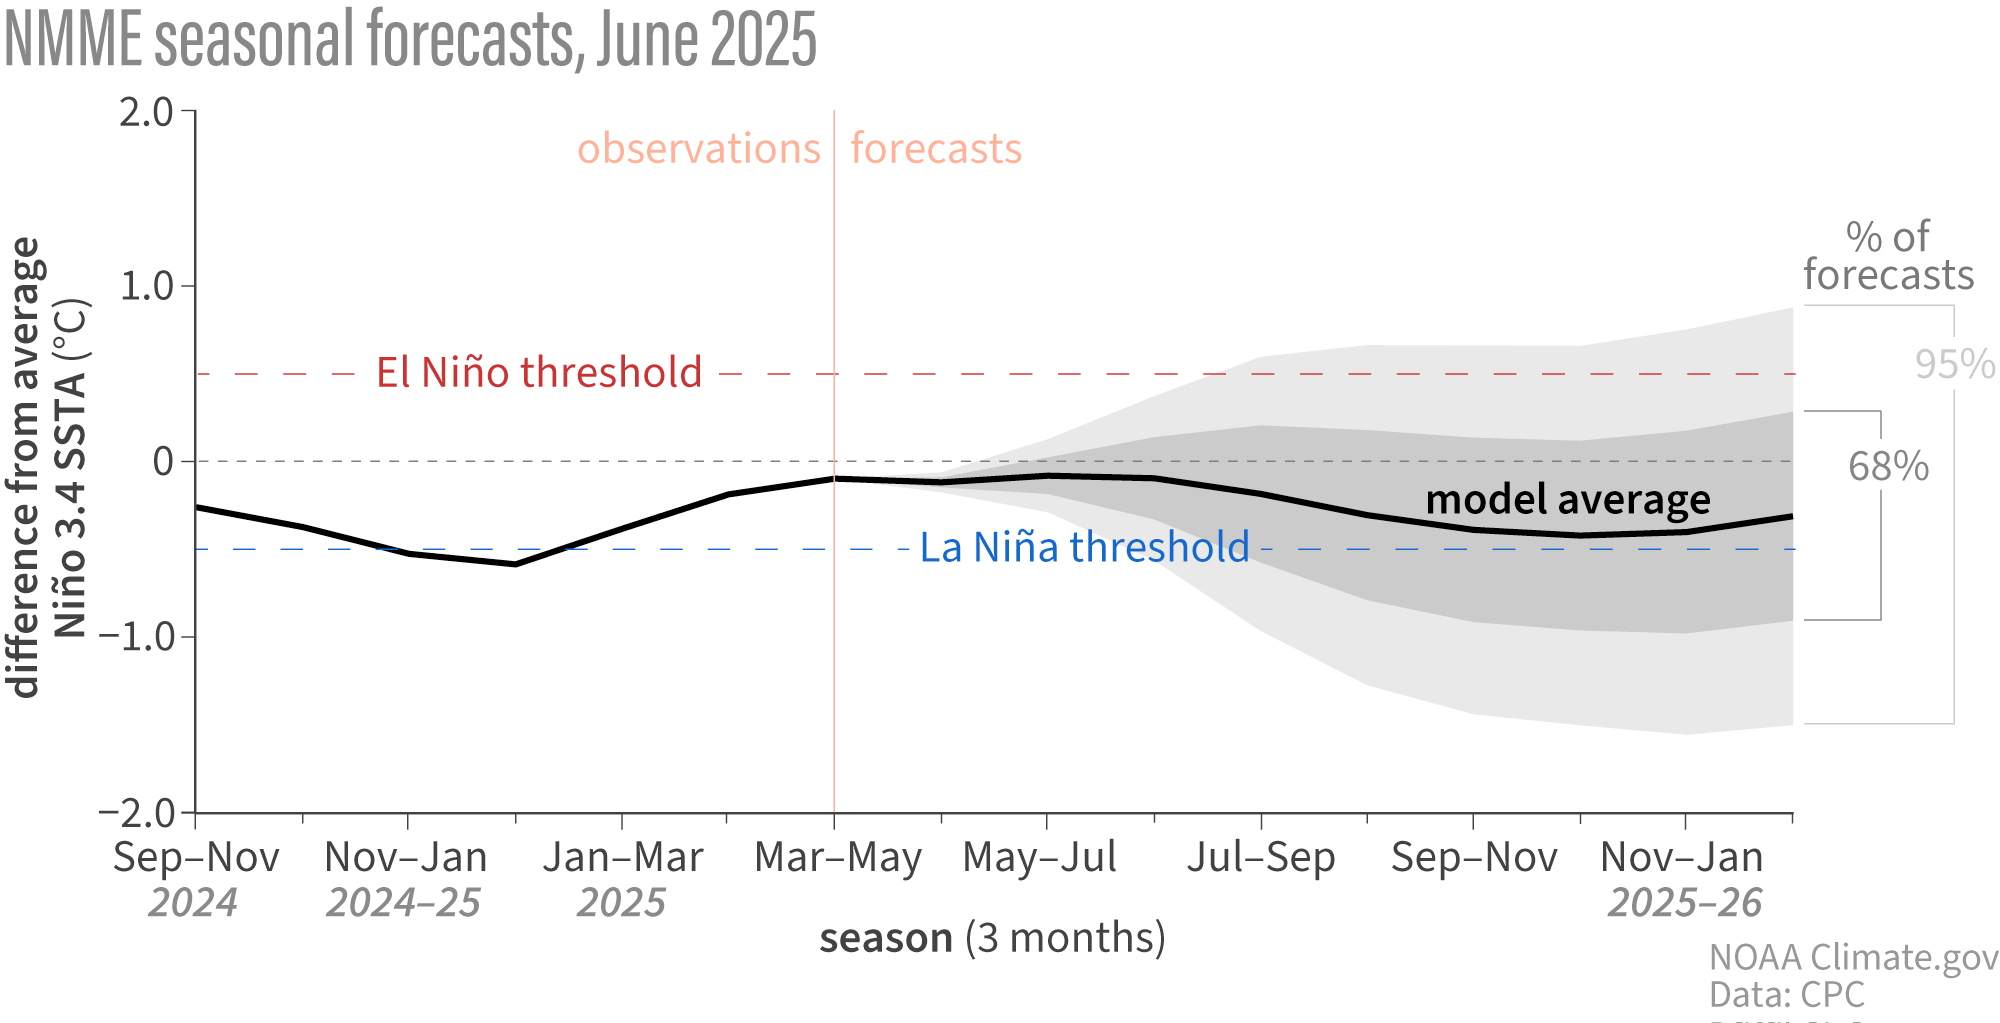
The odds of La Niña increase through the fall but remain lower than the odds of neutral. By the November–January period, there’s a 48% chance of neutral and a 41% chance of La Niña, with El Niño a distant third. Grab your towel, today we’re touring the galaxy of ENSO-neutral and what it means for seasonal prediction.
The story so far: what ENSO is, and why it matters
El Niño and La Niña, known collectively as the El Niño/Southern Oscillation (ENSO), are a system of changes in the tropical Pacific Ocean and atmosphere. El Niño and La Niña alter global atmospheric circulation and the jet streams, affecting weather patterns around the world. El Niño and La Niña can often be predicted many months in advance, giving us an early heads-up for their impacts. ENSO-neutral conditions are in place when neither El Niño nor La Niña are present, and the tropical Pacific Ocean and atmosphere are close to the long-term average temperature and circulation.
El Niño and La Niña have expected impacts on global seasonal weather and climate, but what about neutral? ENSO-neutral doesn’t mean we expect upcoming seasonal rain, snow, and temperature to be close to average. Rather, during neutral, we don’t have the same predictive information that El Niño and La Niña’s atmospheric changes provide, making upcoming patterns harder to predict very far in advance.
The restaurant at the end of the universe: what’s happening in the Pacific right now
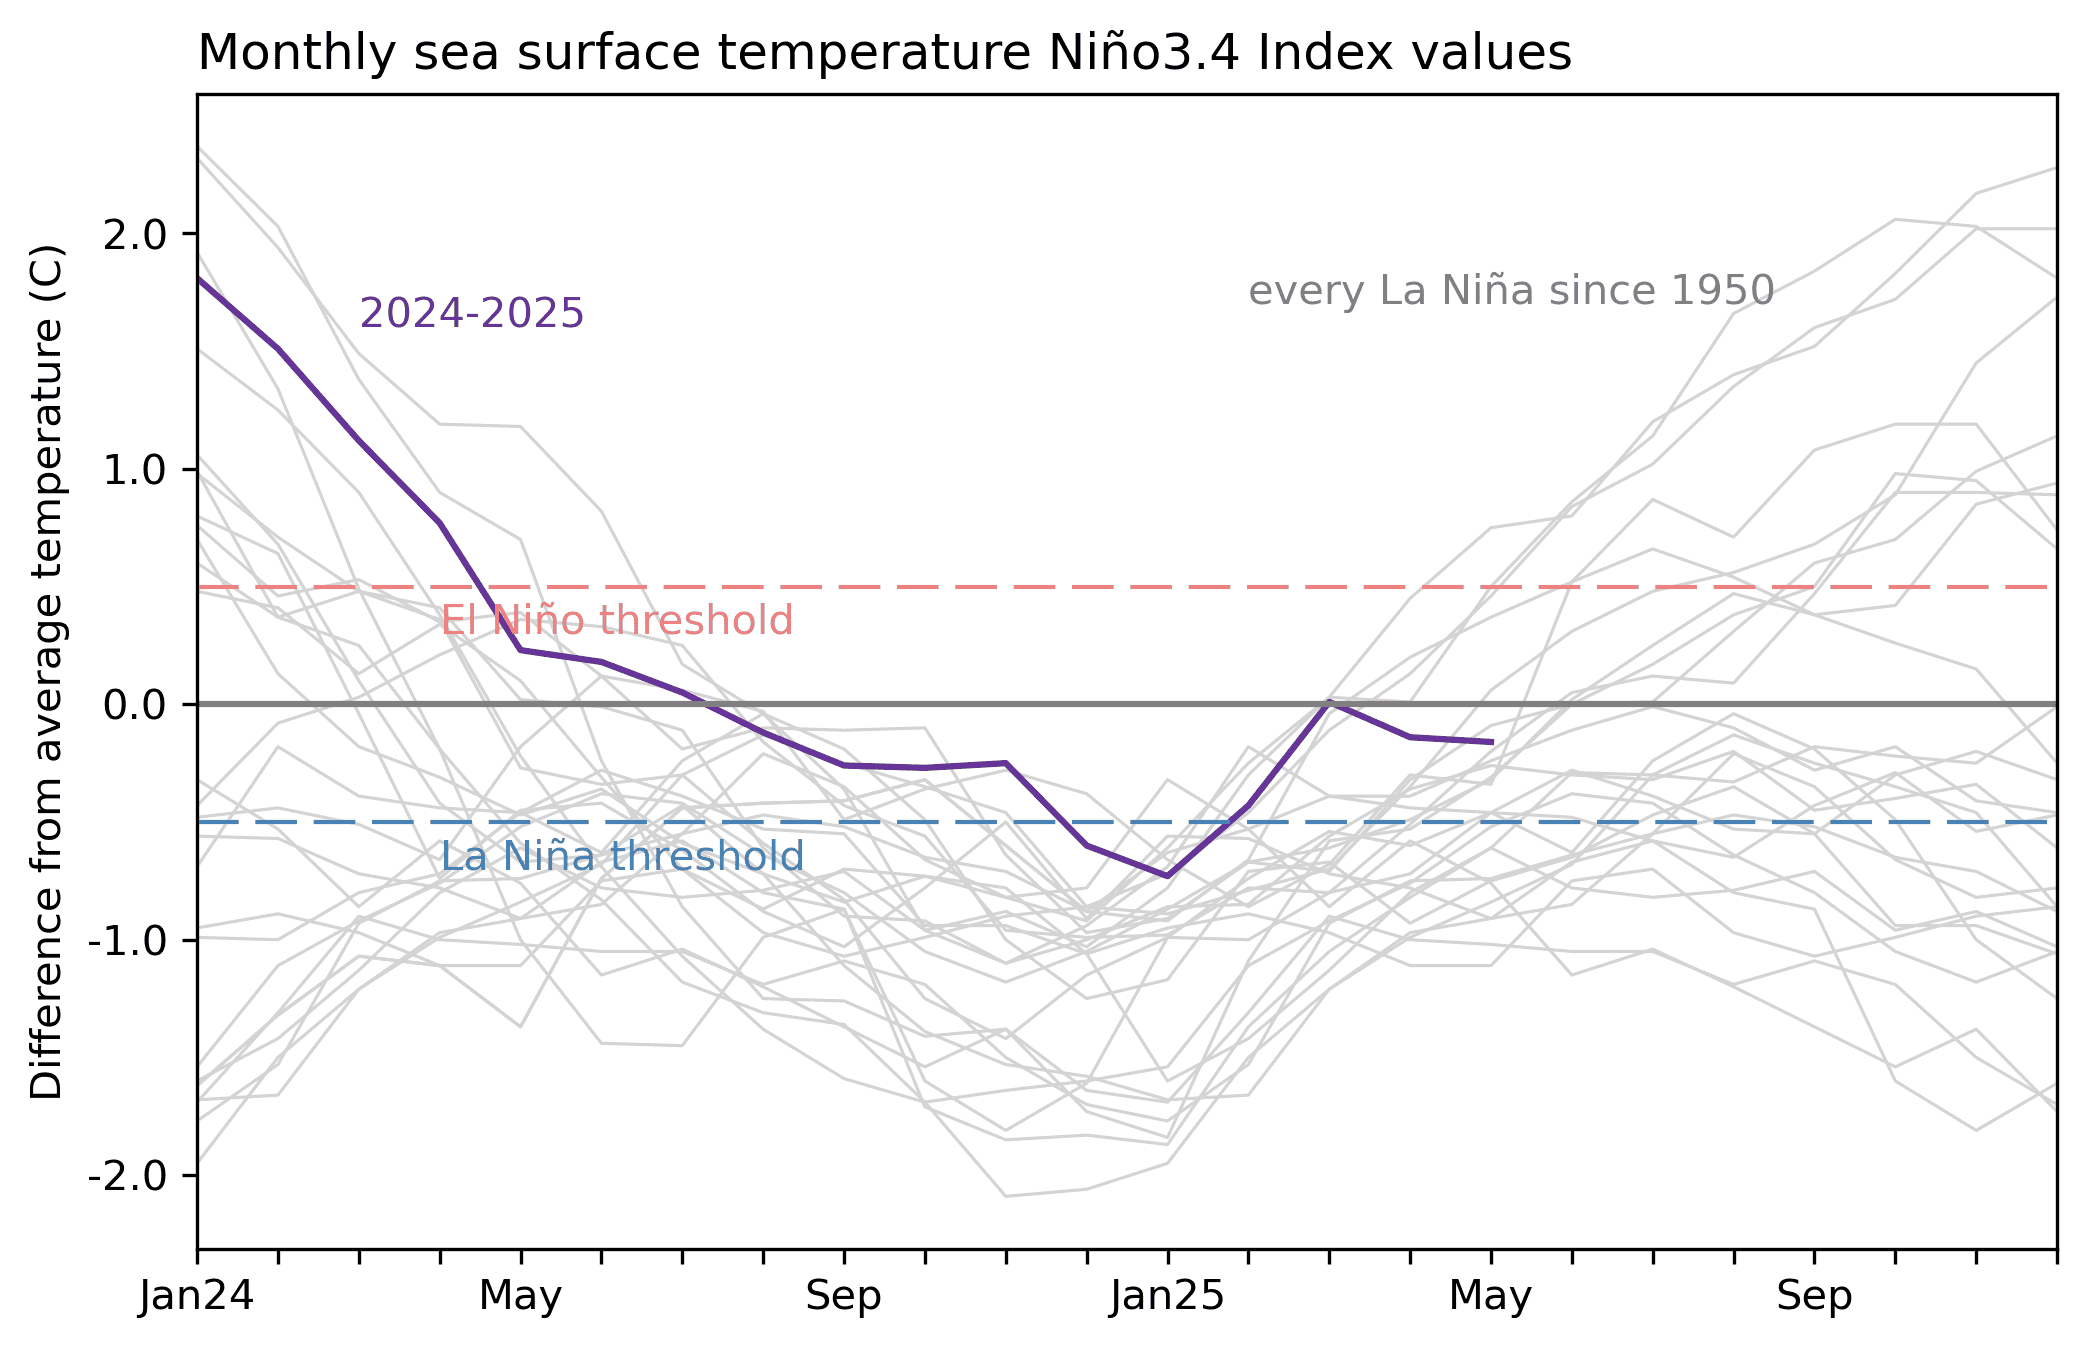
Our primary ENSO measurement, the temperature of the Pacific Ocean surface in the central tropical Niño-3.4 region, has been near average for the past few months, following last winter’s dip below the La Niña horizon. According to our most reliable sea surface temperature dataset, the Niño-3.4 region was 0.2°C(about 0.4°F) cooler than the long-term average in May.
The atmospheric circulation over the tropical Pacific also has looked mostly neutral. This overturning pattern, called the Walker circulation, is characterized by rising air over the far western Pacific and Indonesia, west-to-east winds aloft, sinking air over the eastern Pacific, and the east-to-west trade winds near the surface. During La Niña, the Walker circulation strengthens, while El Niño weakens it. A few La Niña-ish characteristics are still hanging around, including more rising air and more rainfall than average over Indonesia with some regions of stronger easterly trade winds over the tropical Pacific. Despite those fading, localized signs of La Niña, the ocean-atmosphere system across the Pacific as a whole is neutral.
We demand rigidly defined areas of doubt and uncertainty! What the models say about months ahead
It’s very likely that ENSO-neutral conditions will remain through the summer. By the fall, chances of La Niña do increase, but they are still lower than the chance for neutral. El Niño is the least likely, with odds of less than 1-in-8.

This forecast is informed by computer climate models, including those from the North American Multi-Model Ensemble. We consider lots of climate models, which gives us a range of potential outcomes. Most of these model runs fall into the neutral category through the end of 2025, with some in La Niña, and a few in El Niño, informing our forecast probabilities.
In addition to the climate models, we study current conditions in the ocean and atmosphere. One valuable source of information is the pattern of water temperature under the surface of the Pacific Ocean. Our colleague, Caihong Wen of NOAA’s Climate Prediction Center, has been studying ENSO oceanic signals for years. She pointed out that there is a very narrow band of slightly warmer-than-average subsurface water near the thermocline along the equator, with large regions of cooler subsurface water to the north and south.
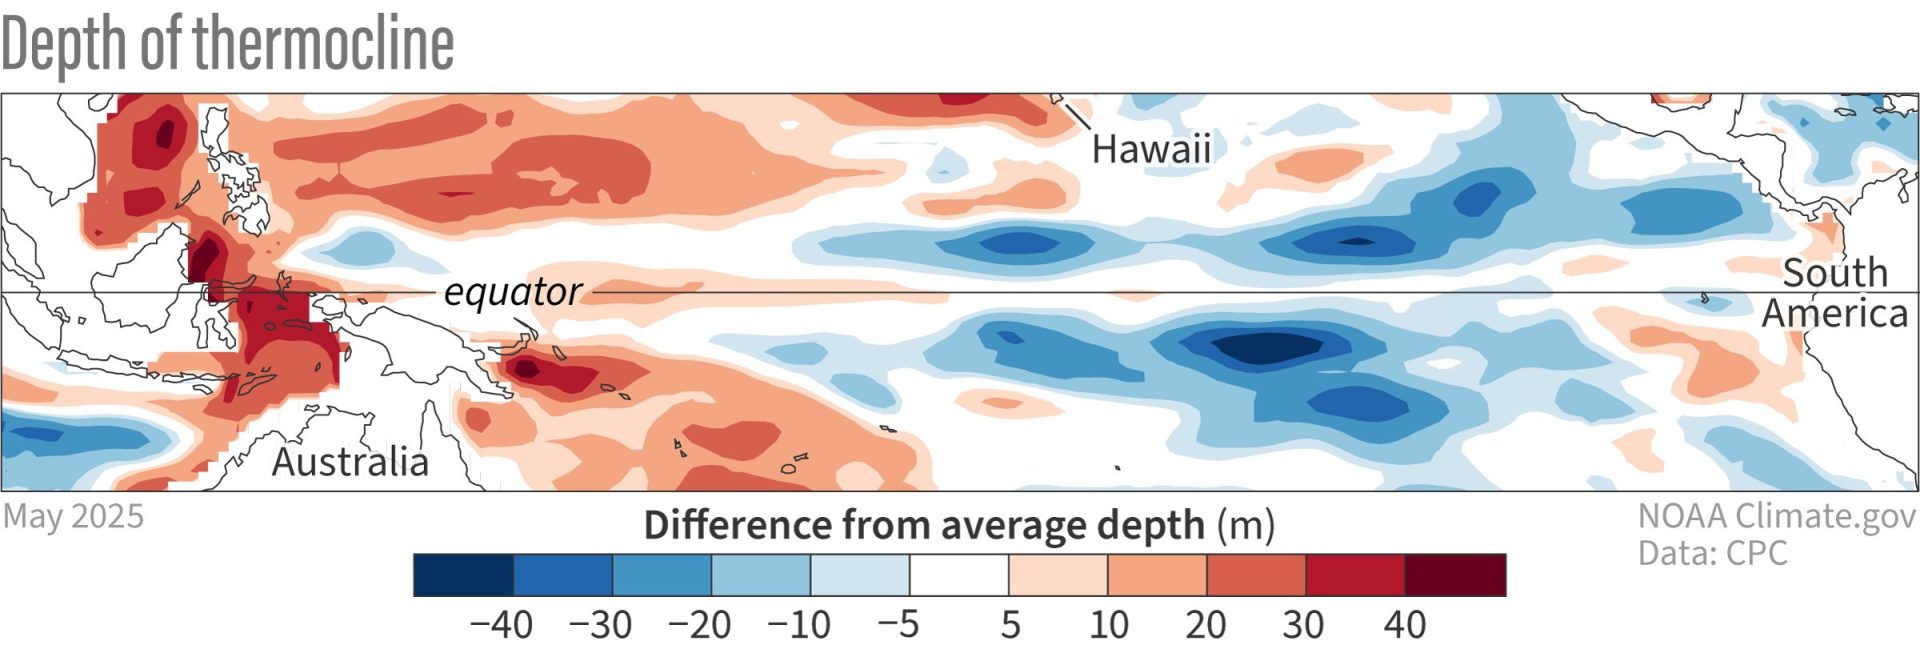
Caihong led some interesting research a few years ago showing that this off-equator subsurface water can provide a source for a developing El Niño or La Niña event. For example, a pattern of cooler subsurface water like we’re seeing now preceded second-year La Niña events in 2008, 2011, and 2017. It’s not a strong enough relationship for a confident prediction of La Niña, but it may help explain why some of the model forecasts are tilting in a La Niña-ish direction.
Infinite improbability drive
Let me leave you today with a reading selection from our past 11 years of ENSO blogs, since we didn’t get around to it on our birthday last month. Curious about how ENSO helps with predicting tornadoes? Check out these posts from 2017, 2021, and just last month. ENSO influences the hurricane season—find out more in these articles from 2014, 2017, and 2024. Weather and climate extremes—including drought, heatwaves, atmospheric rivers, coastal flooding, and the range of daily temperature—are affected by El Niño and La Niña. Our runaway most popular post was about how ENSO changes snow patterns (read the La Niña follow up post here). We chronicled the strong El Niño events of 2015–16 and 2023–24, the endless La Niña of 2020–23, and had some funalong the way. Our smart, inquisitive audience, and the relationships we’ve formed along the way, make this the best place to be on the internet. Thanks for reading!