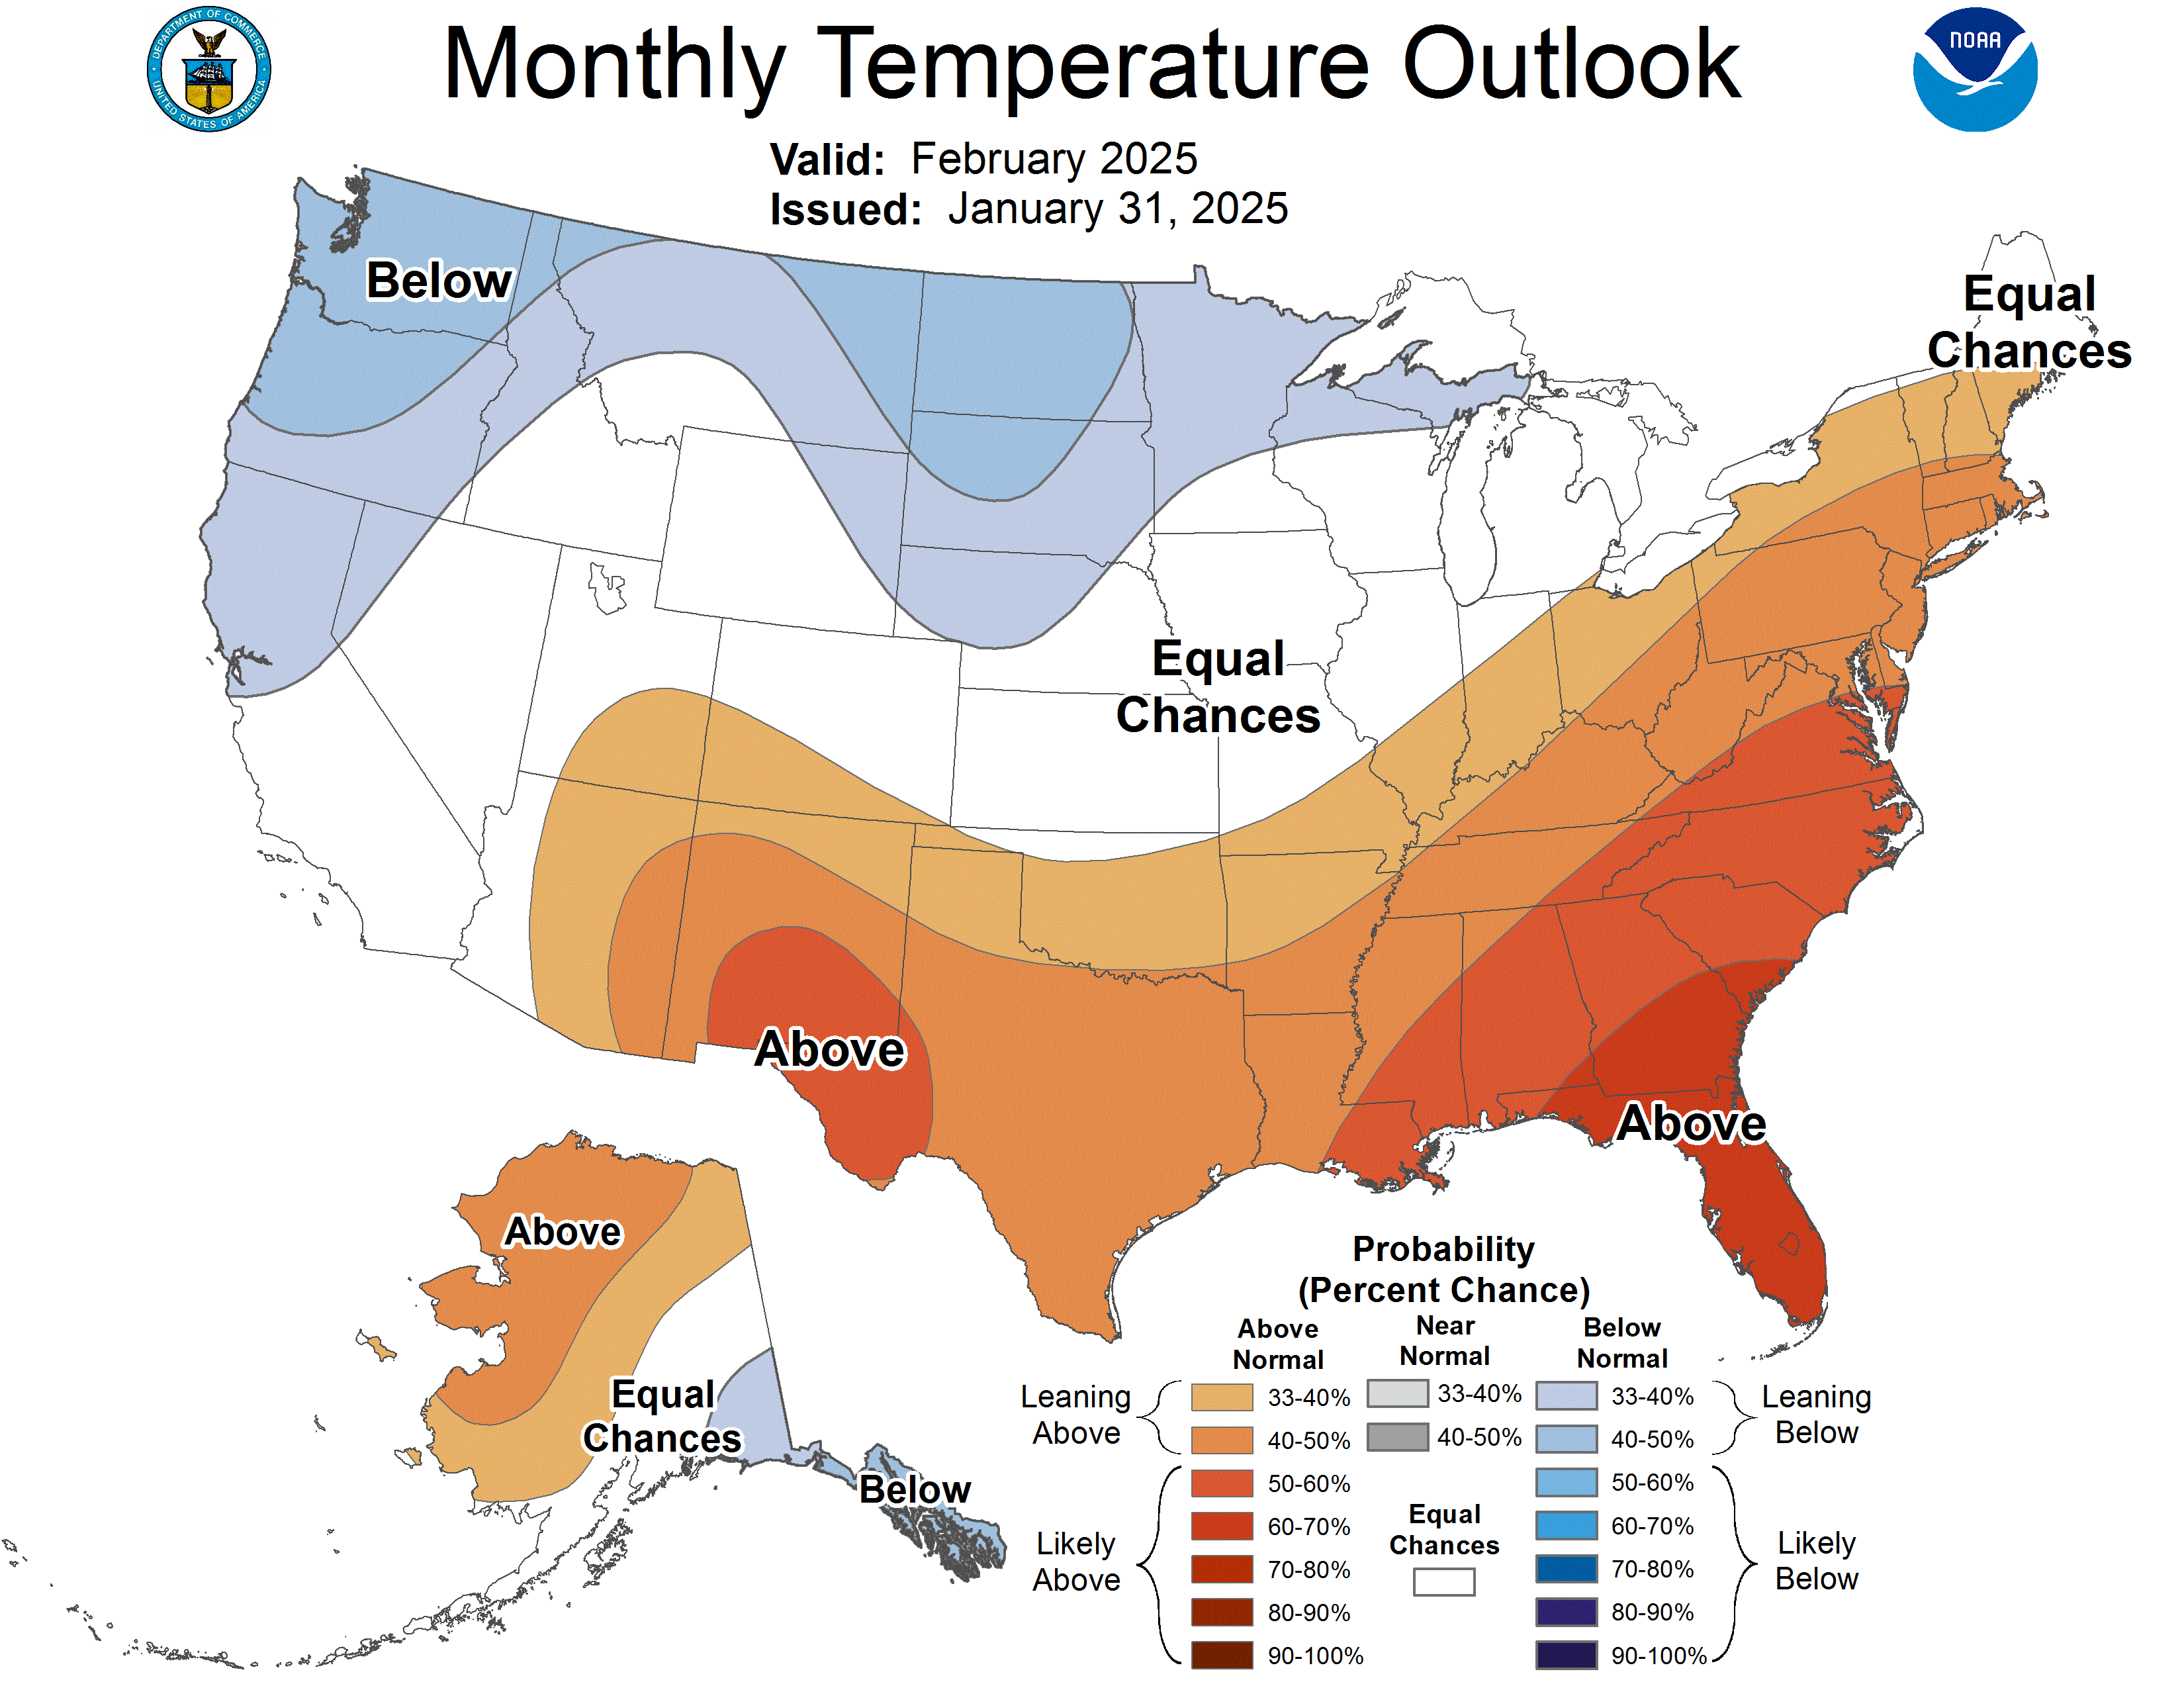
The NOAA just released its outlook for February 2025. It’s looking good for northern regions, and also the northeast.
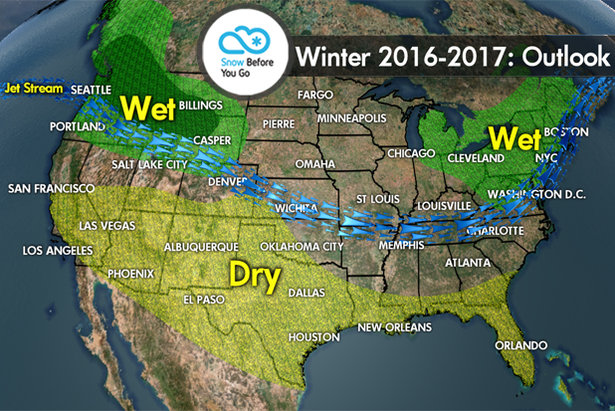
tl;dr: La Niña conditions are expected to influence February 2025 weather patterns across the United States. The forecast predicts above-normal temperatures for much of the southern and eastern U.S., while the northern regions may experience below-normal temperatures. Precipitation is likely to be above-normal in the Pacific Northwest, Northern Rockies, and much of the northern and central U.S., with below-normal precipitation expected in the Southwest, southern Plains, and Southeast.
- Related: [UPDATED: December 20] NOAA Winter 2024-25 Forecast: La Niña and the Rest of the Ski Season
A summary is below, and the full discussion at the bottom.
February 2025 Winter Weather Outlook
The National Weather Service has released its 30-day outlook for February 2025, providing valuable insights for ski and snowboard enthusiasts. This forecast considers various factors, including La Niña conditions, the Arctic Oscillation, and the Madden-Julian Oscillation, to predict temperature and precipitation patterns across the United States.
Temperature Predictions
Below-normal temperatures are expected in key ski regions of the Western United States. The forecast indicates increased chances of colder-than-average conditions from the Pacific Northwest eastward across portions of the Intermountain region, far northern Rockies, and the northern Great Plains. This could mean excellent conditions for maintaining snow cover at many ski resorts in these areas.
However, the southern and eastern parts of the country are likely to experience above-normal temperatures. Florida and portions of Georgia and South Carolina are predicted to experience the highest probabilities (60-70%) of warmer weather. Ski resorts in the Northeast and Mid-Atlantic might face challenges if this warmer trend extends to their regions.
Precipitation Outlook
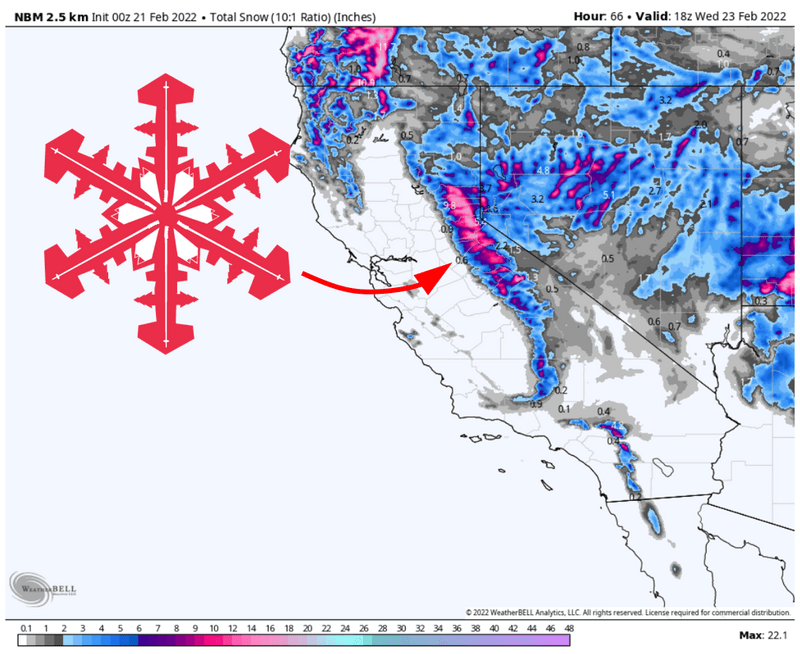
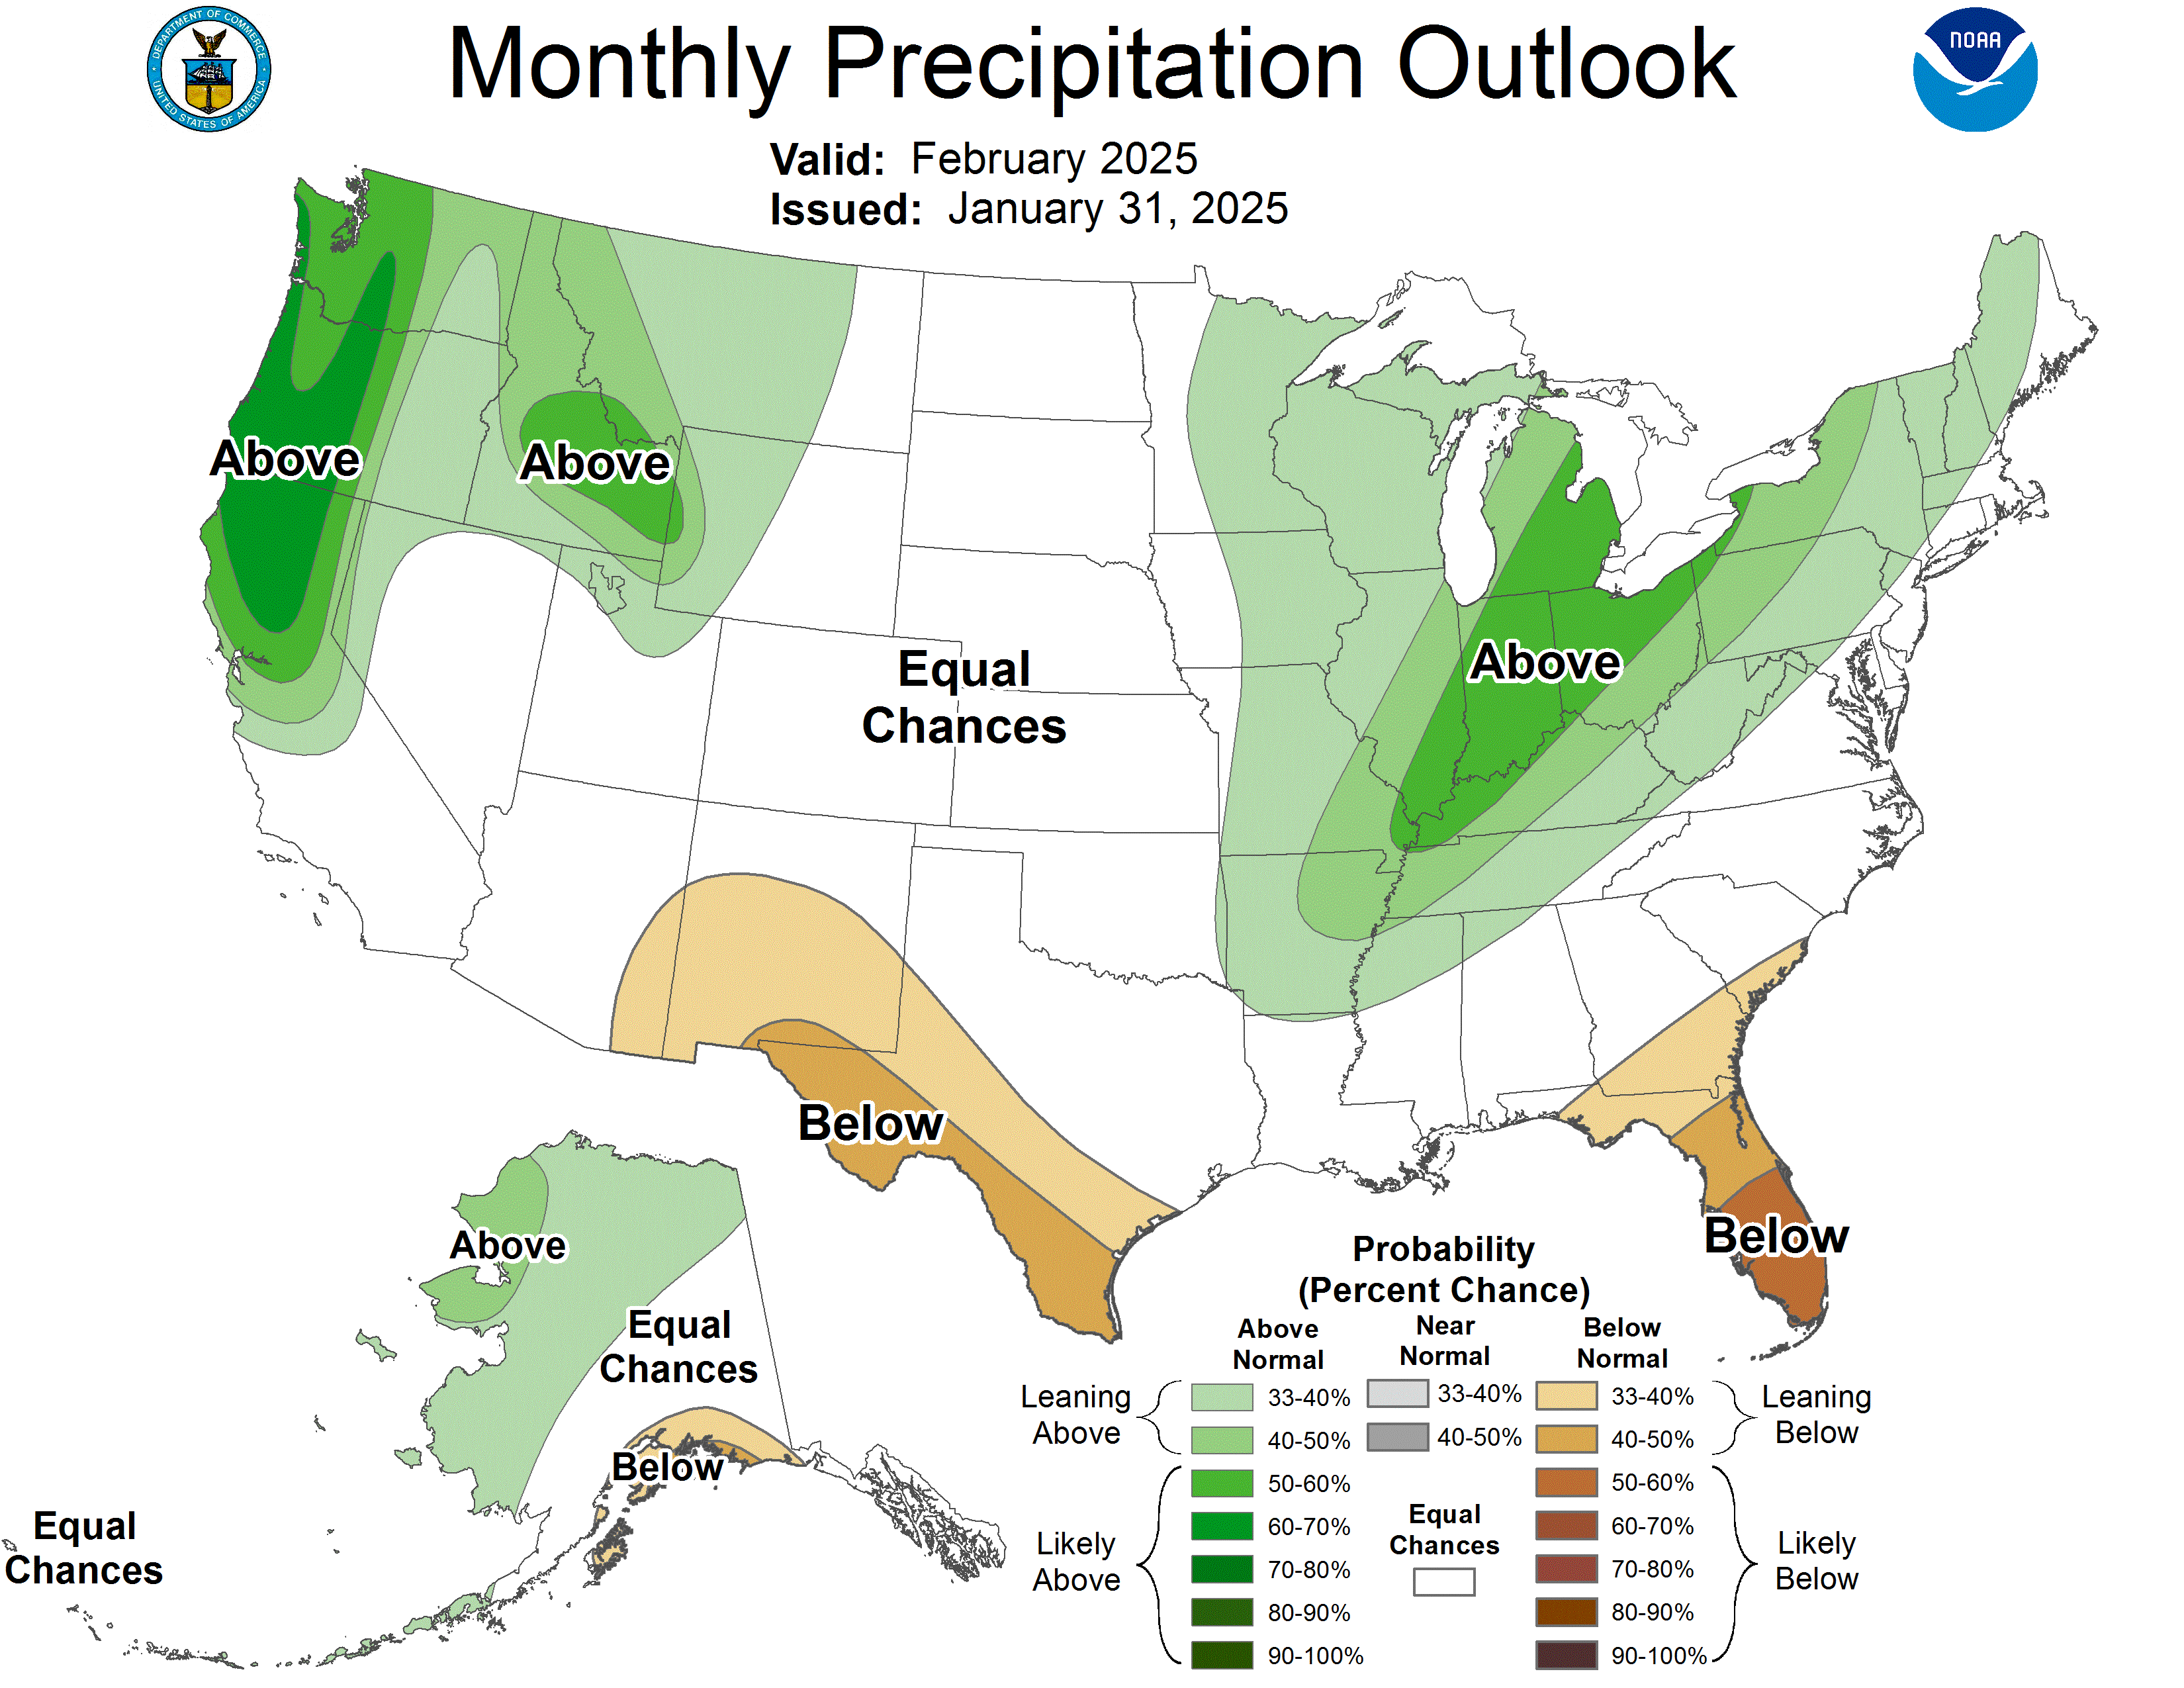
Good news for powder hounds in the West! The forecast predicts increased chances of above-normal precipitation from northern and central California and the Pacific Northwest eastward across the northern Intermountain region to eastern Montana. The highest probabilities (60-70%) are indicated for the Coastal Ranges and Cascades of the Pacific Northwest, extending southward across the Klamath range and northern and central Sierras of California.
The first week of February looks particularly promising for the West Coast. Predictions suggest 3-8+ inches of precipitation (liquid equivalent) associated with atmospheric river activity. This could translate to significant snowfall at higher elevations, potentially creating excellent conditions for skiing and snowboarding.
The outlook is mixed for other regions. Above-normal precipitation is favored across most of the Mississippi Valley, the Great Lakes region, Ohio and Tennessee Valleys, most of the Appalachians, and interior portions of the Northeast and Mid-Atlantic. However, drier conditions are expected in the Southwest, including eastern Arizona, most New Mexico, and western and southern portions of Texas.
Implications for Skiers and Snowboarders
Western ski resorts, particularly those in the Pacific Northwest and Northern Rockies, may experience ideal conditions in February 2025. Combining below-normal temperatures and above-normal precipitation could result in excellent snow accumulation and preservation.
Resorts in the Northeast and Mid-Atlantic should be monitored closely. While interior portions may see increased precipitation, the general trend toward warmer temperatures could affect snow quality and coverage, especially at lower elevations.
Southern ski areas might face challenges. The forecast for above-normal temperatures and below-normal precipitation in parts of the South could lead to less favorable skiing conditions.
As always, local conditions can vary significantly from broader regional forecasts, so checking specific resort reports closer to your planned ski dates is advisable.
30-DAY OUTLOOK DISCUSSION FOR FEBRUARY 2025

The updated monthly temperature and precipitation outlooks for February 2025
are based primarily on WPC’s Week-1 temperature and precipitation forecasts,
two-week GEFS and European Prediction System (EPS) ensemble mean temperature
and precipitation dynamical forecasts, CPC’s Week-2 and Weeks 3-4 temperature
and precipitation outlooks, subseasonal GEFS/CFSv2 guidance, the most recent
runs of the monthly CFSv2 temperature and precipitation forecasts, and on weak
La Niña composites. In addition, the latest information regarding the Madden
Julian Oscillation (MJO), snow cover, Great Lakes ice coverage, and the latest
30-day temperature and precipitation observations were also considered.

The updated temperature outlook for February 2025 calls for increased chances
of below normal temperatures over southeastern Alaska, and from the Pacific
Northwest and the northern half of California eastward across portions of the
Intermountain region and far northern Rockies, the northern third of the Great
Plains, northern portions of Minnesota and Wisconsin, and the Upper Peninsula
of Michigan. This is based on a subjective consensus of the various official
outlooks and model runs noted earlier that comprise the monthly time period.
Above normal temperature chances are elevated for much of the southern and
eastern contiguous U.S. (CONUS). Maximum probabilities of 60-70% are depicted
over Florida and portions of Georgia and South Carolina. In the eastern CONUS,
this is consistent with MJO lagged temperature composites with the enhanced
convective phase propagating through the Maritime Continent region. However, it
is noted that the composites also show a trend towards colder temperatures in
the East towards the end of February. The widespread coverage of favored above
normal temperatures across much of the CONUS is supported by historical La Niña
composites, the CFSv2, and the subseasonal GEFS-CFSv2 temperature guidance.
Above normal temperatures are also favored over approximately the northern and
western halves of Mainland Alaska, based on GEFS and EPS 2-meter temperature
anomalies through the first half of February, the CFSv2 model, and GEFS-CFSv2
subseasonal temperature guidance. Equal Chances (EC) of below, near, and above
normal temperatures are favored for remaining areas where models and tools
displayed weak and/or conflicting signals .

The updated precipitation outlook for February 2025 depicts increased chances
of above normal precipitation from northern and central California and the
Pacific Northwest eastward across the northern Intermountain region to eastern
Montana. Maximum probabilities of 60-70% are indicated for the Coastal Ranges
and Cas cades of the Pacific Northwest, extending southward across the Klamath
range and northern and central Sierras of California. This broad pattern of
favored above normal precipitation is generally consistent with historical La
Niña precipitation composites. For the West Coast area, anywhere from 3-8+
inches of precipitation (liquid equivalent) is predicted to fall within the
first week of February associated with atmospheric river activity. Chances
favoring above normal precipitation are also elevated across most of the
Mississippi Valley, the Great Lakes region, Ohio and Tennessee Valleys, most of
the Appalachians, and interior portions of the Northeast and Mid-Atlantic.
Maximum probabilities of 50-60% are depicted from the vicinity of the
Mississippi-Ohio River Confluence northeastward across most of the eastern half
of the Great Lakes region. This is consistent with much of the objective model
guidance and La Niña composites, and denotes the expected location of the mean
storm track. Odds favoring below normal precipitation are enhanced for eastern
Arizona, most of New Mexico, western and southern portions of Texas, and much
of the Southern Atlantic region. These favored areas of relative dryness are
commonly observed during La Niña winters, though the indicated spatial coverage
of below normal precipitation is significantly reduced relative to moderate or
strong La Niña composites. Maximum odds of 50-60% favoring below normal
precipitation are indicated over southern Florida. For Alaska, a combination of
dynamical model guidance and La Niña composites slightly favors above normal
precipitation chances over northern, central, and western Mainland Alaska,
continuing southwestward across much of the Aleutians, and below normal
precipitation chances over parts of southcentral and southeastern Mainland
Alaska. Equal Chances (EC) of below, near, and above normal precipitation is
favored for remaining areas where models and tools displayed weak and/or
conflicting signals .

—- The 0.5-month lead message for the February 2025 outlooks is shown below: —-

The long-awaited transition from a neutral El Niño Southern Oscillation (ENSO)
to a weak La Niña finally occurred during December 2024, with the latest weekly
value of the Oceanic Niño Index (ONI) of -0.7C for the Niño 3.4 region.
Below-average sea-surface temperatures (SSTs) now dominate the central and
east-central Pacific with significant subsurface cooling to a depth of 100-200
meters. Broad expanses of enhanced (suppressed) tropical convection are noted
over the vicinity of Indonesia (Date Line), with persistently enhanced
low-level trade winds over the western and central near-equatorial Pacific. La
Niña conditions are expected to persist through the Feb-Mar-Apr (FMA) 2025
season with odds of 59 percent, followed by a nearly equally likely transition
to ENSO-neutral starting in Mar-Apr-May (MAM) 2025.

In addition to La Niña being the expected primary driver of the atmospheric
circulation pattern in February, there is significant forcing associated with
the Arctic Oscillation (AO) and the Madden-Julian Oscillation (MJO). The AO
index has been negative during the past two weeks, which has likely contributed
to the current cold snap across the central and eastern contiguous U.S.
(CONUS). The AO index is forecast to transition toward its positive phase in
the next 2 weeks, which may signify at least a brief reprieve from the
persistent influence of Arctic air masses over this portion of the country. In
the tropics, the convectively enhanced phase of the MJO is currently in the
Western Hemisphere, near the interface of Realtime Multivariate MJO (RMM)
Phases 8 and 1. During the past 10-14 days, there has been a very significant
increase in amplitude of the MJO signal, though there has been little eastward
propagation. Most RMM-based MJO Index forecasts predict a high-amplitude MJO
accelerating to phase speeds more consistent of a convectively-coupled Kelvin
Wave, as the signal traverses the remainder of the Western Hemisphere, Africa,
the Indian Ocean, and reaches the Maritime Continent during the next two-week
period. Historically, an MJO signal propagating eastward across the Indian
Ocean and Maritime Continent favors a warm response downstream over the central
and eastern CONUS towards the end of January, but this is contradicted by most
dynamical model guidance which favors the continuation of below normal
temperatures across this region.

Other considerations for the February outlooks include coastal SSTs, sea and
lake ice, and snow cover. At the present time, near to primarily above normal
SSTs prevail near the West Coast of the CONUS, the western and central Gulf
Coast, and near the southwest coast of Alaska. Below normal SSTs are observed
near the coast of the Northeast CONUS. Most of the Alaska coast as far south as
Kuskokwim Bay (Southwest Alaska) is dominated by sea ice. Over the Lower 48
states, the Great Lakes remain mostly ice-free as of mid-January, with
relatively shallow Lake Erie being the most likely to freeze over during the
next few weeks. Current snow cover is widespread across the northern and
central CONUS, with associated radiational cooling helping to keep surface
temperatures lower over this area.

The monthly Temperature and Precipitation Outlooks for February are based on
historical La Niña composites and regressions and the secondary forcings
described above, as well as on dynamical and statistical model support.
Dynamical support is derived from dynamical model suites including the North
American Multi-Model Ensemble (NMME), Copernicus Climate Suite (C3S), and from
the Climate Forecast System version 2 (CFSv2) dynamical model. Statistical
support comes largely from a combined ENSO-OCN tool, and to a lesser degree the
Canonical Correlation Analysis (CCA). CPC’s official outlooks for Weeks 3-4,
and monthly and submonthly temperature and precipitation guidance from the
Global Ensemble Forecast System (GEFS), CFSv2, and European Centre for
Medium-Range Weather Forecasts (ECMWF) models are also used in the preparation
of the February Outlooks, though it is important to note that these forecasts
only cover the first half of February.

The February 2025 Temperature Outlook features elevated odds of above normal
temperatures over the vicinity of the Four Corners states/Southwest, southern
Plains, Lower Mississippi and Tennessee Valleys, the Southeast, Upper Ohio
Valley, most of the Appalachians, Mid-Atlantic, and Northeast. Probabilities of
above normal temperatures reach 50 to 60 percent over parts of the southern
Rockies. This broad pattern is characteristic of part of the typical cold
season La Niña signature, and is supported by available models and tools such
as the dynamical consolidation (NMME CON), NMME Probability Anomaly Correlated
(PAC) calibrated forecasts, C3S, and recent runs of the CFSv2. Below normal
temperature chances are enhanced from the Pacific Northwest eastward across
much of Montana, the Northern and Central Plains, and the Upper Mississippi
Valley. This is supported by the statistical consolidation (Stat CON), recent
runs of the CFSv2, the ENSO-OCN tool which combines influences of ENSO and
trends, and the ECMWF and Deutscher Wetterdienst (DWD, German model) which are
constituents of the Copernicus model Suite (C3S). Other constituents such as
the United Kingdom Met Office (UKMO) and Meteo-France models appear to be too
warm overall. This broad area of favored anomalous cold is also very typical of
classic wintertime La Niña events. In Alaska, many tools support some variation
on the classic La Niña theme which is characterized by increased chances for
below normal mean temperatures across southcentral and southeast Alaska, and
increased chances for above normal mean temperatures confined to northwest
portions of the Mainland.

The February 2025 Precipitation Outlook features elevated odds for above normal
precipitation from the Pacific Northwest eastward across the Northern
Intermountain region and Northern Rockies to the northern High Plains. This is
generally associated with the Pacific jet stream as it traverses much of the
northern CONUS. One of the few dissenting opinions comes from the Stat CON
(specifically the CCA input) which favors below normal precipitation across the
Pacific Northwest and was discounted for this particular forecast. Above normal
precipitation chances are also increased for much of the Mississippi Valley,
Tennessee and Ohio Valleys, Great Lakes region, central and northern
Appalachians, and interior portions of the Mid-Atlantic and Northeast.
Probabilities of above normal precipitation reach 50 to 60 percent percent from
the central Great Lakes region southwestward towards the Missouri Bootheel.
This second region of favored anomalous storminess is associated with a typical
meandering of the jetstream across this region and the resulting mean storm
track, and is consistent with many of the precipitation tools. Approximately
half of the available tools forecast above normal precipitation reaching the
Northeast and Mid-Atlantic coasts, and while this is certainly reasonable with
individual cyclonic systems, the La Niña storm track on average tends to be
shifted farther inland. There are enhanced odds of below normal precipitation
from far southern California generally eastward across much of the Four Corners
region, the central and southern High Plains, much of Texas, far southern
Mississippi Valley, and a large portion of the Southeast as far north as the
Tidewater area of southeastern Virginia. Probabilities reach 50 to 60 percent
over the vicinity of the Rio Grande Valley, and also most of Florida,
southeastern Georgia, and nearby parts of South Carolina. This broad region of
favored drier than normal conditions is consistent with the typical La Niña
footprint, and is well supported by many tools, such as the Stat and NMME CONs
and the CFSv2 to name a few. Over Alaska, above normal precipitation chances
are elevated over most of the Mainland north of the Alaska Range, with a sliver
of slightly enhanced below normal precipitation chances over parts of
southcentral and southeastern Mainland Alaska. These predicted anomalies are
generally consistent with mean surface high pressure and mid-level ridging over
the Gulf of Alaska during La Niña events.

FORECASTER: Anthony Artusa