

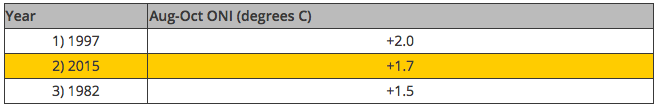
Yesterday, NOAA reported that the current El Nino is the strongest El Nino in 18 years just behind the 1997 El Nino event. At this point, it appears clear that the current El Nino event will not become stronger than the 1997 El Nino and will most likely en up being the 3rd strongest El Nino event on record.
“The strongest El Niño in 18 years continues to intensify and is likely to be one of the three strongest on record by the time it peaks this winter, according to a monthly outlook from NOAA released Thursday morning.” – the weather channel via NOAA’s latest El Nino data
The current El Nino, in region 3.4, was recently measured at +1.7 degrees above average as the mean sea surface temperature from August to October 2015, which is the 2nd highest measurement for that zone at that time of year on record.
What Does El Nino Mean for the USA?
“Seasonal outlooks generally favor below average temperatures and above-median precipitation across the southern tier of the United States, and above-average temperatures and below-median precipitation over the northern tier of the United States.” – NOAA yesterday
It’s as simple as that. More precip and more cold for the south, less precip and less cold for the north. In reality, if you’re looking for more than than, you’re looking for too much…
If we’re smart, we’ll all move to Taos, New Mexico this winter to ski incredible terrain in eep El Nino snow.
NOAA’s official November El Nino Update can be found here: November El Nino Advisory
A more user friendly version of the update from NOAA is below.
November El Niño update: It’s a small world
The peak of our current El Niño is expected to occur in the next month or so… but what does that mean? We measure El Niño events by how much warmer the surface waters in a specific region of the equatorial Pacific are, compared to their long-term average. The difference from average is known as the “anomaly,” and we use the average anomaly in the Niño3.4 region as our primary index for El Niño. When the index in this region is at its highest, we have our peak El Niño.

Average sea surface temperature departure from the 1981-2010 average over the four weeks ending on November 7. Graphic by climate.gov, data from NCEP-NCAR reanalysis.
However, El Niño-related impacts have been occurring around the globe for months already, and will continue for several months after the warmest temperatures occur in the tropical Pacific Ocean. For example, during the 1997-98 El Niño, the Niño3.4 Index peaked at 2.33°C in November (using ERSSTv4 data, the official dataset for measuring El Niño), and the most substantial U.S. effects occurred through the early spring of 1998. A bit later in this post, we’ll take a look at what’s been going on so far this year.
First, a quick update on the recent El Niño indicators
The average anomaly in the Niño3.4 region during August-October of this year was 1.7°C, second to the same period in 1997 (1).
![]()
Ranking of August-October average sea surface temperature departures from the mean for all El Niño episodes since 1950. This measurement, the Oceanic Niño Index, uses ERSSTv4 data. Figure by climate.gov, data from CPC.
The atmospheric response to the warmer waters is going strong. The Walker Circulation (tropical near-surface winds blowing from east to west, and upper-level winds blowing from west to east) is substantially weakened, as we expect during a strong El Niño.

Top: Recent departure from the 30-year average near-surface winds. Purple shading area indicates where the normally easterly (blowing from east to west) winds are weaker than normal. Bottom: Recent departure from the 30-year average upper-level winds in the tropical Pacific region. Purple shading area indicates where the normally westerly (blowing from west to east) winds are weaker than normal. Maps by climate.gov, data from NCEP-NCAR reanalysis.
In case you’re unimpressed by a 2°C (3.6°F) change, let’s do a little math. The area covered by the Niño3.4 region is a little more than 6 million square kilometers (2.4 million square miles). One cubic meter of water weighs 1,000 kg. So the top two meters (6.6 feet) of the Niño3.4 region contains about 12 quadrillion kilograms (about 13.6 trillion tons) of water.
The energy required to raise one kilogram of water one degree Celsius (the “specific heat”) is 4.19 kilojoules. A 2°C increase in just the top two meters of the Niño3.4 region adds up to an extra 100 quadrillion kilojoules (95 quadrillion BTUs), about equal to the annual energy consumption of the U.S.!
Who’s feeling the effects?
In the U.S., the season of strongest El Niño impacts is December through March. While we’re waiting to see what the strong 2015-16 El Niño brings us, we’ll look around a few other corners of the world to see what’s happened so far.
El Niño has substantial impacts in two regions of Africa. I checked in with the Climate Prediction Center’s International Desk to see what’s been going on. In East Africa, including Ethiopia, Somalia, Kenya, Tanzania, Uganda, Burundi, and Rwanda, the primary impact season is October–December, when El Niño tends to enhance the ”short rains” rainy season (the “long rains” season, which is much less ENSO-sensitive, is March-May), leading to wetter conditions. Over the last month, rain has begun to increase across much of the area, and some flooding has been seen in Somalia. Short-term forecasts suggest the wetter conditions should continue through the next few weeks, at least.

Monthly precipitation departure from the long-term average during October 2015. Map by climate.gov, data from the CPC ARC2.
Southern Africa, including Zimbabwe, Botswana, Namibia, Angola, South Africa, Lesotho, Swaziland, and the southern half of Mozambique, tends to see a drier December–February during an El Niño. Areas of this region, especially South Africa, are very dry right now, after a failed monsoon last year. Another dry year would place more stress on water availability. You can check out recent rainfall conditions in Africa here, and see climate model forecasts for the continent here.
In a couple of short sentences, here are some huge impacts: El Niño-related dry conditions in Indonesia have set the stage for devastating fires, and the region is experiencing the greatest number of forest fires since 1997. Also, all the extra warm waters associated with this El Niño are placing heat stress on sea life, and an intense coral bleaching event is underway.
El Niños tend to enhance the hurricane season in the Pacific, and depress the Atlantic hurricane season. Phil Klotzbach of Colorado State University had this to say about the wild Pacific hurricane season: “So far this year, there have been a total of 21 Category 4 and 5 storms in the North Pacific, shattering the old record of 17, set in 1997. The North Central Pacific region (140-180W) has shattered records for most named storms, hurricanes, and major hurricanes tracking through the 140-180W region.”
According to Lindsey Long of the Climate Prediction Center, the Atlantic season has been fairly quiet, although the number of named storms has been close to average, at 11 storms so far (including Kate, which formed on Monday). The average is about 12… but the overall activity of this storm season (the combined strength and duration of all storms, measured as the Accumulated Cyclone Energy (ACE) has been less than 60% of average, and we’ve had 3 hurricanes, half the average number of 6.
We won’t know until next spring what exact impact this El Niño will have on the U.S., but it is already making its presence felt around the world.


