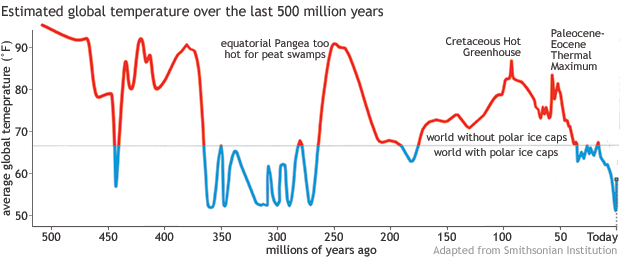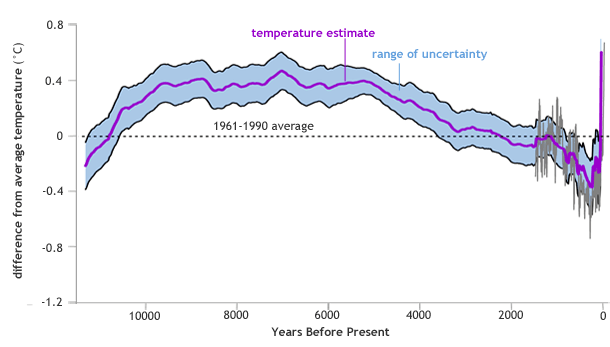
Earth has experienced many temperatures over time, from historical high temperatures to ice ages and our modern climate. Earth has experienced a range of climates and temperatures over time. There have been notable thermal maximums in Earth’s history. Scientists research these thermal maximums and compare them to current climate trends.
Earth was at its peak temperature just after its formation, during a period of time called the Hadean Eon, 4,540 million years ago. The Hadean Eon is named after Hades, the Greek god of the underworld, and is characterized by extremely high temperatures and violent volcanic activity. During the Hadean Eon, the temperature at the upper reaches of the atmosphere was thought to average 3,600℉.

Since the Hadean Eon, Earth has experienced many periods of high average temperatures. Within the last 100 million years alone, there have been two thermal maximums. The Cretaceous Thermal Maximum, or CTM, occurred 90 million years ago and was caused by extremely high levels of atmospheric CO2. During the CTM there were 1,000 parts per million atmospheric CO2. For comparison, pre-industrial levels of atmospheric CO2 were around 280 parts per million.

The most recent thermal maxim occurred 55-56 million years ago. Called the Paleocene-Eocene Thermal Maximum, or PETM, this time period saw global average temperatures of around 70℉. For reference, Earth’s current global average temperature is just below 60℉. During the beginning of the PETM, temperatures increased by 11℉ over a period of 20,000 years.
Scientists have mathematically compared the carbon emission rates of the PETM and modern emissions. They have found that current carbon emission rates are almost 10 times higher than those found in the PETM. As the Earth has moved out of its last ice age, the average temperature increased by 4-7 ℃ over a period of 5,000 years. In the past century, Earth’s average temperature has increased by 0.7℃, which is ten times faster than the pre-industrial average.

In fact, Earth’s current average temperature is higher than the average temperature for the past 11,300 years. Climate scientists are 95% certain that the rapid increase in global average temperature is being driven by human-caused greenhouse gas emissions. While it is true that Earth has seen higher average temperatures in the past, the current abrupt increase in average temperatures is causing rapid change on a global scale.


My degree was in Chemistry and I was wondering if you have a temperature graph using 2 sigma instead of one sigma. It would be much more helpful.
Be good to have a link to the appropriate dept in the Smithsonian, so that we can obtain the full version of this graph.